Stay up to date with all things Impira, automation, document processing, and industry best practices.
By subscribing, I agree to Botpresso’s Terms of Service and Privacy Policy.
Drowning in Exploration reports just to track AI traffic? You’re not alone, and there’s a smarter way. Instead of building endless custom reports, why not bring AI traffic insights straight into your GA4 dashboard?
In this guide, I’ll walk you step by step through creating a clean, easy-to-read AI Traffic Dashboard in GA4.
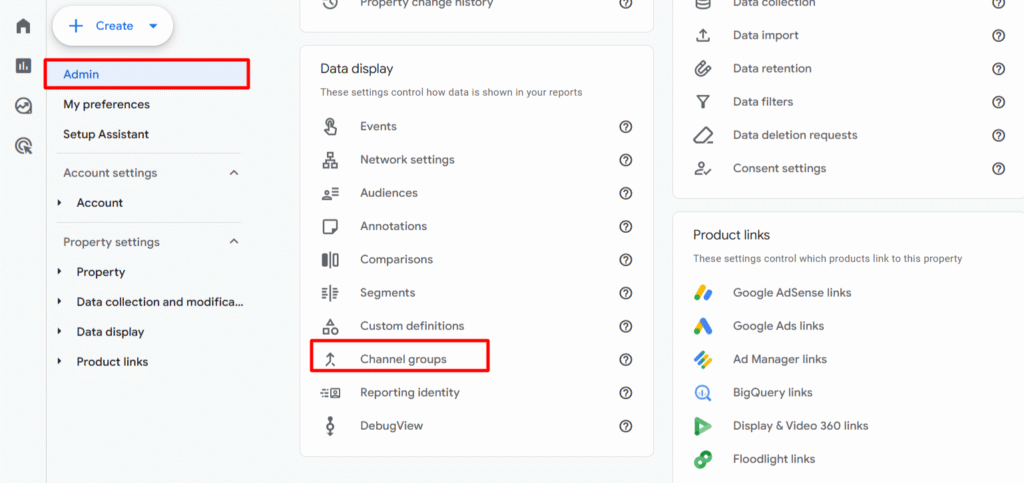
Step 1 – Create a new Channel Group through Admin
Click on Admin, go to the data display dropdown & click on Channel Groups
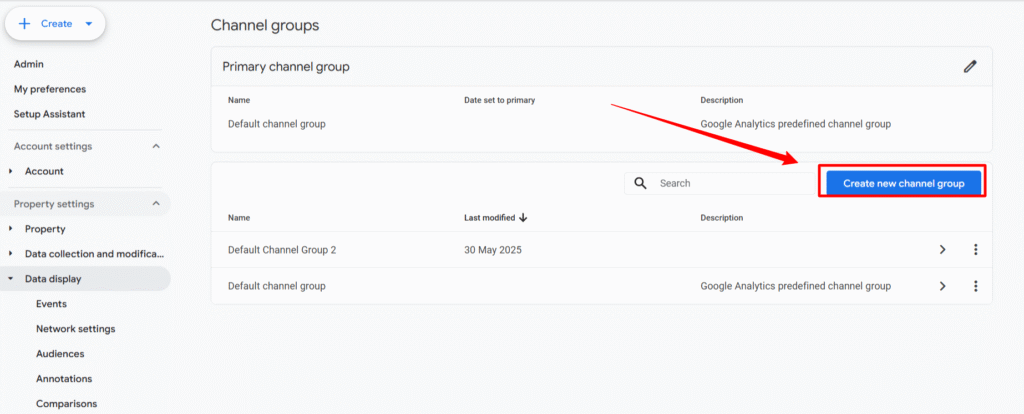
Step 2 – Click on Create new Channel group
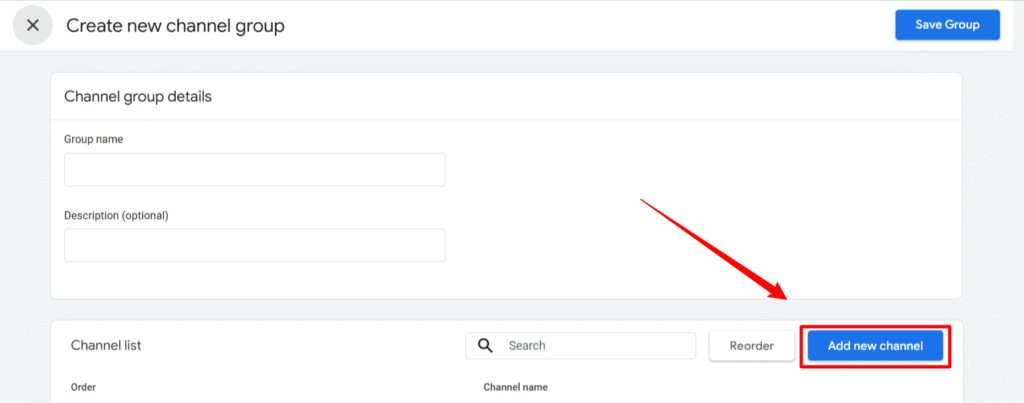
Step 3 – Click on Add new channel
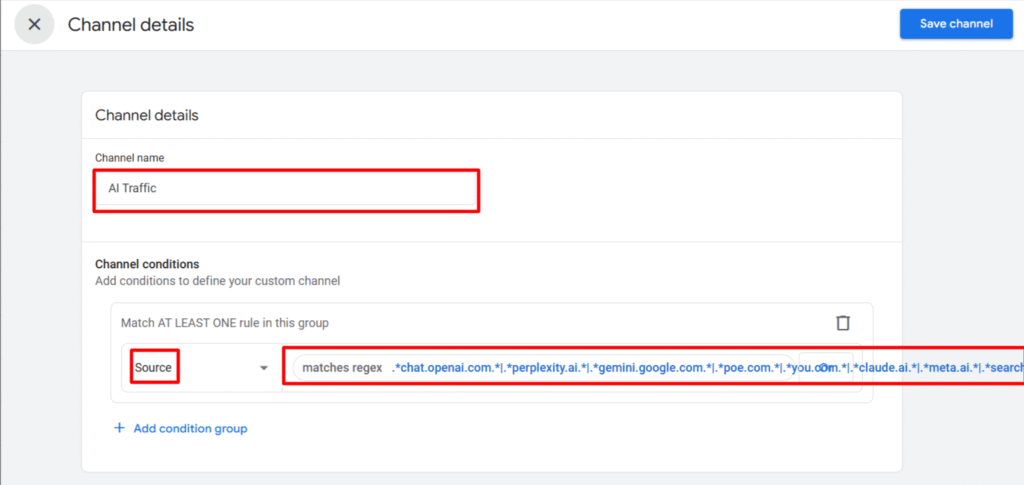
Step 4 – Name the channel as AI Traffic & Source Matching AI Traffic Page Referrer Regex
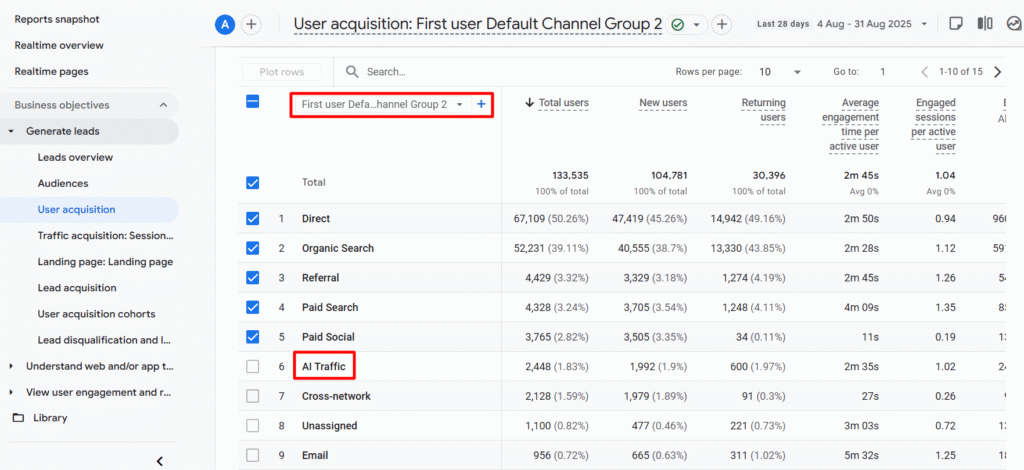
Step 5 – Select Your Custom Channel Group in Reports
Now you can view AI Traffic directly in your main GA4 Reports, eliminating the need to create Exploration Reports for various aspects.
By setting up this dashboard, you’ve streamlined the way you monitor AI traffic in GA4. No more digging through Exploration reports—everything you need is now just a click away in your main reports. This not only saves time but also gives you a clearer, faster view of how AI-driven sessions impact your overall performance. Now, you’re equipped to track AI traffic with ease and focus on what truly matters: turning those insights into action.