Table of Contents
It was one fine Saturday!
Me & my friend were chatting on WhatsApp. (Obviously!)
“Can you share a good resource to learn Python?” he asked.
I shared Wes McKinney’s ‘Python For Data Analysis’ e-book with him. It was the 3rd edition.
“May I know why you want to learn Python suddenly?” I asked.
“I’m working on a data-intensive project,” he said, “Yesterday, I was working with Google Sheets. It crashed.🥲”
“Arghh, horrible.”
I felt sorry for him. I know we all would have been in this situation at least once. I have gone through these events more than a dozen times! The conversation made me create this bite-sized content for you to replace Google Sheets with Pandas & Juypter Notebook.
Before discussing how to move from Excel or Google Sheets to Python’s pandas, let’s take a step back and break it down.
What is the “pandas” in Python?
🐼 Pandas is a popular open-source Python library used for data manipulation and analysis.
To make it simpler:
Pandas help you handle and work with data easily. It’s a powerful tool that simplifies tasks like organizing data into tables (like spreadsheets), filtering out specific pieces of information, performing calculations, and much more. So, Pandas is your go-to helper whenever you need to work with data in Python!
What is the Jupyter Notebook?
Jupyter Notebook is an open-source application that makes it convenient to write, run, and share Python code, all in one place! It is popular among people who work with large sets of data. It is commonly used for data analysis, visualizations, and machine learning.
Why Pandas & Jupyter Notebook to replace Google Sheets/Excel?
- It can handle millions of rows of data efficiently, which might slow down Google Sheets or Excel.
- No crashes.
- Code can be easily saved and shared, ensuring the reproducibility of data analysis tasks.
- You can automate tasks, which can save time and reduce errors
- Pandas integrates seamlessly with other Python libraries for data analysis and visualization.
How to move from Google Sheets/Excel to Pandas in Python?
⌛Preparations:
Step 1: Installing Jupyter Notebook
Go to this URL – https://docs.anaconda.com/free/miniconda/miniconda-install/ and download the minconda installer.
Follow the instructions on the screen to install the Miniconda distribution that has Jupyter Notebook.
Step 2: Open Jupyter Notebook
From the Windows start menu, search for ‘Anaconda Prompt.’ Click on it to open the command line. In the Anaconda prompt window, type in ‘jupyter notebook’ and click enter to open the notebook.

The Jupyter Notebook opens up on your browser.
Step 3: Create a new notebook
Go to File > Notebook.
It would open a new notebook where we can import CSV files or an Excel workbook and perform the operations.
🐼time to address the ‘pandas’ in the room!
We have installed minconda and opened up Jupyter Notebook. We will be performing the Excel or Google Sheets operations on Jupyter Notebook using Pandas.
To use Pandas, we need to import the module into Jupyter Notebook. To do that, enter the following code in the cell and use CTRL+Enter to run the code:
import pandas as pd
🔥Now, let’s do some Excel/Google Sheets operations in Python Pandas.
1. Reading CSV file
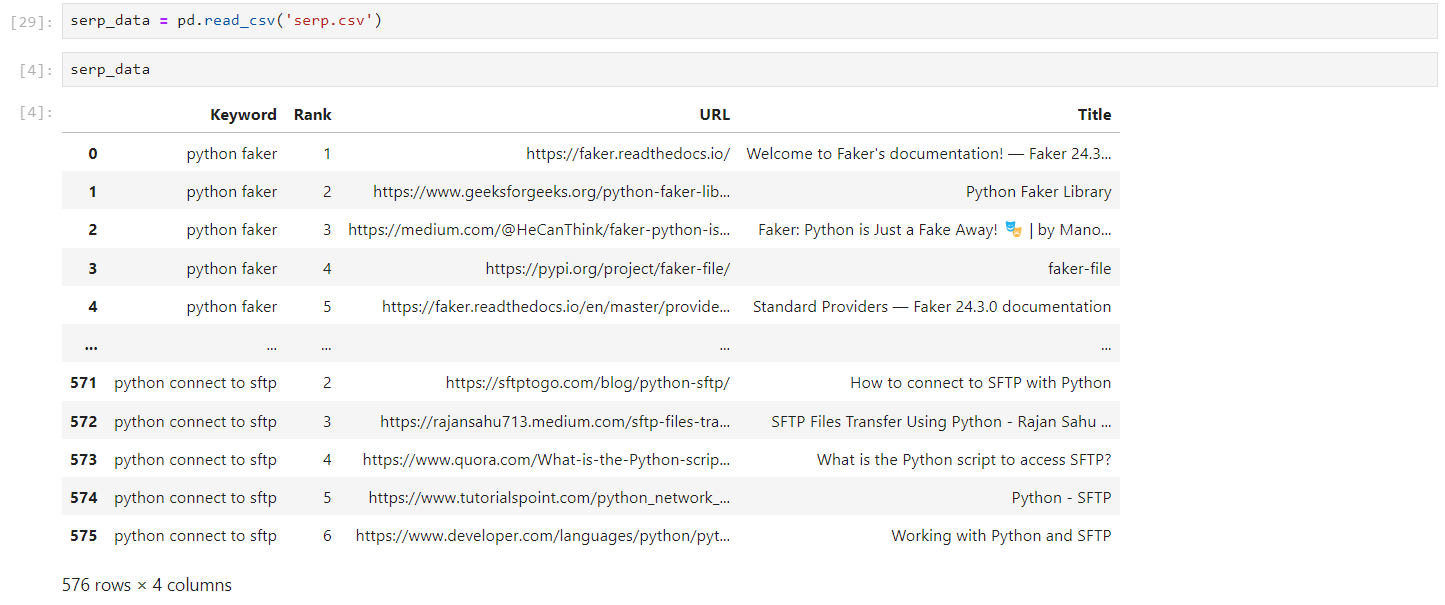
Just like how we import CSV files in Google Sheets, we will import the CSV file into Pandas to work with it.
For that, we need to use a one-line code that goes like this:
serp_data = pd.read_csv(‘serp.csv’)
Enter the code in a cell after the import function and use CTRL+Enter to run the code.
That’s it. You just opened a CSV file in Jupyter Notebook and saved it in a file (variable) ‘serp_data.’
So whenever you want to see the CSV file, you just have to enter the variable name, which in this case is ‘serp_data.’
In Google Sheets, we will have to import files one by one using File > Import manually. But with Pandas, you can just copy/paste the one-line code to open multiple files.
2. Count rows & columns
Get an overview of the number of rows and columns in your data frame (worksheet) using the following shape function:
serp_data.shape
3. Adding filters
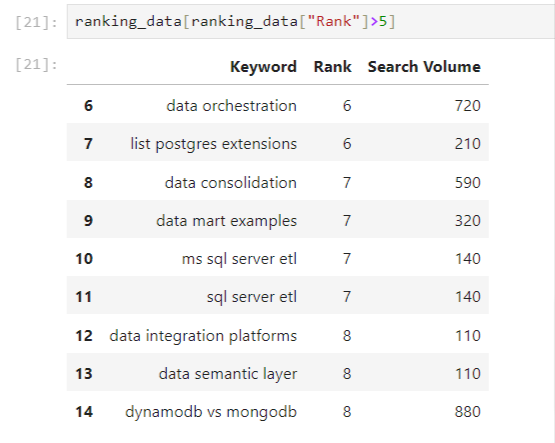
Just like how you do filtering on Google Sheets, you can add filters on Pandas too. Here’s an example of how you can filter keywords ranking in positions greater than 5:
ranking_data[ranking_data[“Rank”]>5]
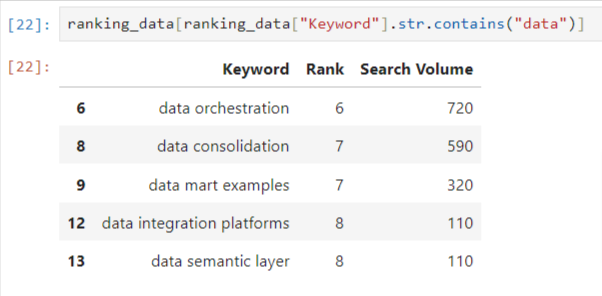
Another example of how you can filter the data by keywords containing the term ‘data’ using the ‘string contains’ function of pandas.
ranking_data[ranking_data[“Keyword”].str.contains(“data”)]
4. Concatenation
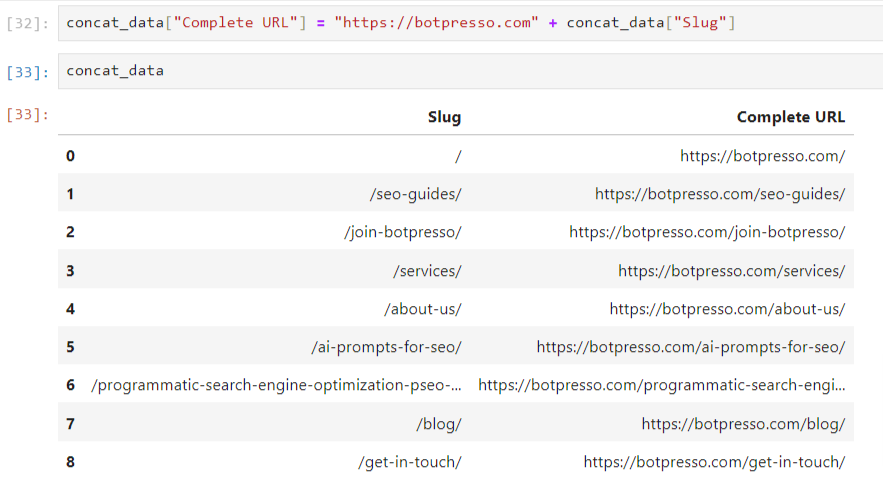
Using concatenation to change the relative URL to the absolute URL.
concat_data[“Complete URL”] = “https://botpresso.com” + concat_data[“Slug”]
5. Remove duplicates
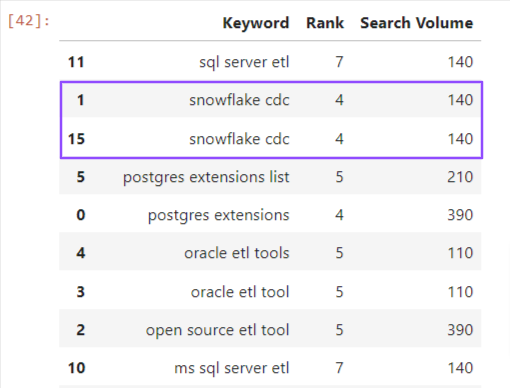
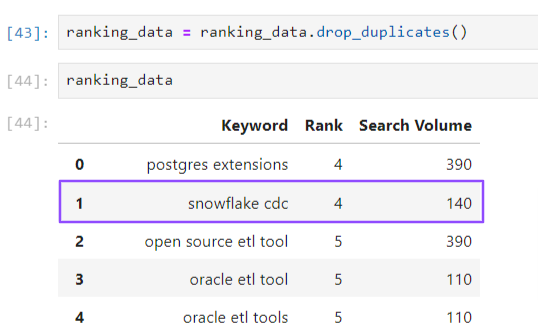
Clean up your data by removing duplicate rows using the drop_duplicates() function.
ranking_data = ranking_data.drop_duplicates()
Before dropping duplicates 👇
After dropping duplicates 👇
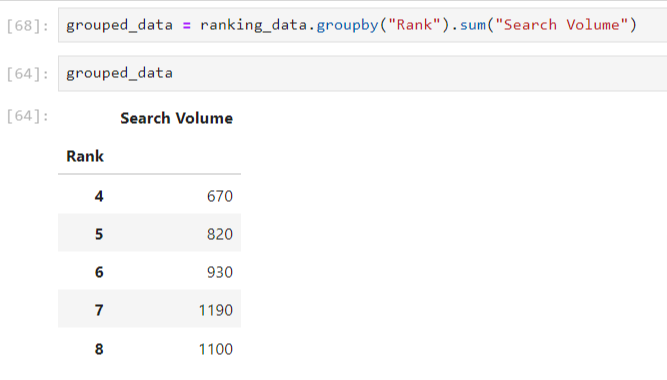
6. Grouping data
Grouping the ranking data by the sum of the search volume of keywords in each ranking bucket.
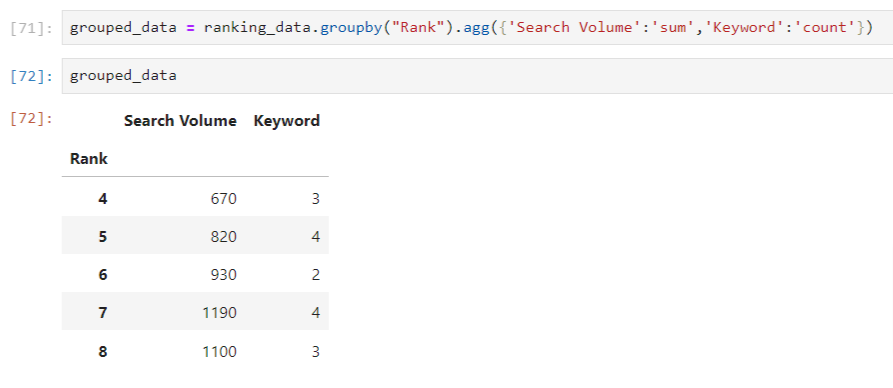
You can add more layers to the data by adding keyword count in each ranking bucket using the agg() function.
grouped_data = ranking_data.groupby(“Rank”).agg({‘Search Volume’:’sum’,’Keyword’:’count’})
This way, you can see how many keywords are in each ranking bucket, and their overall search volume.
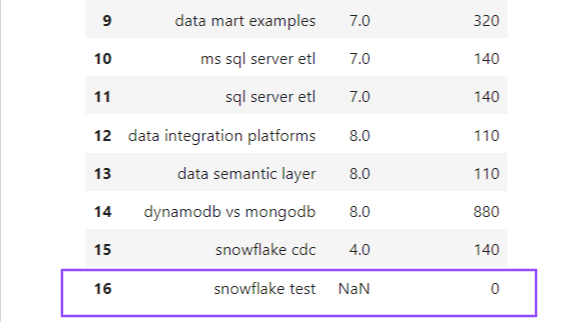
7. Remove null values
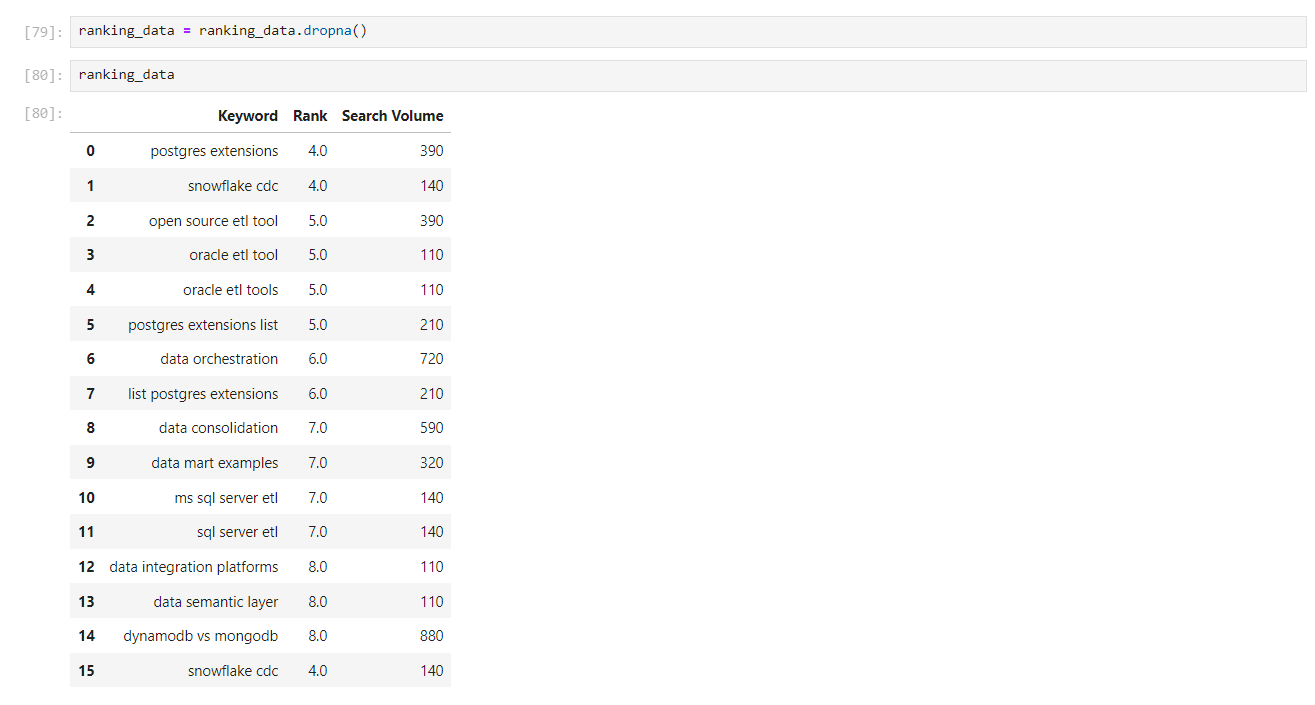
Remove the rows containing empty/null values using the dropna() function in pandas.
ranking_data = ranking_data.dropna()
👇Data before removing null values:
👇Data after removing null values:
8. Pivot table
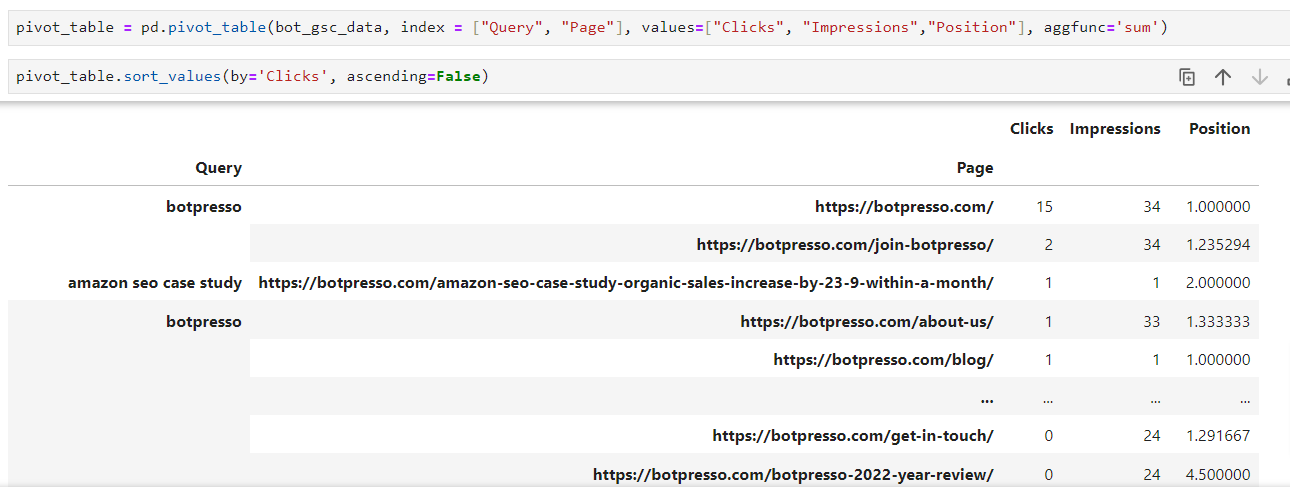
Just like Google Sheets or Excel, you can create pivot tables in Pandas too using the pd.pivot_table function.
pivot_table = pd.pivot_table(bot_gsc_data, index = [“Query”, “Page”], values=[“Clicks”, “Impressions”,”Position”], aggfunc=’sum’)
👇 Here’s the syntax:
pivot_table = pd.pivot_table(your dataframe, index = [“Column 1”, “Column 2”], values=[“Value 1”, “Value 2″,”Value 3”], aggfunc=’sum/mean/any operation’)
💡 It is necessary to pass on the data frame and at least one column and value.
9. VLOOKUP
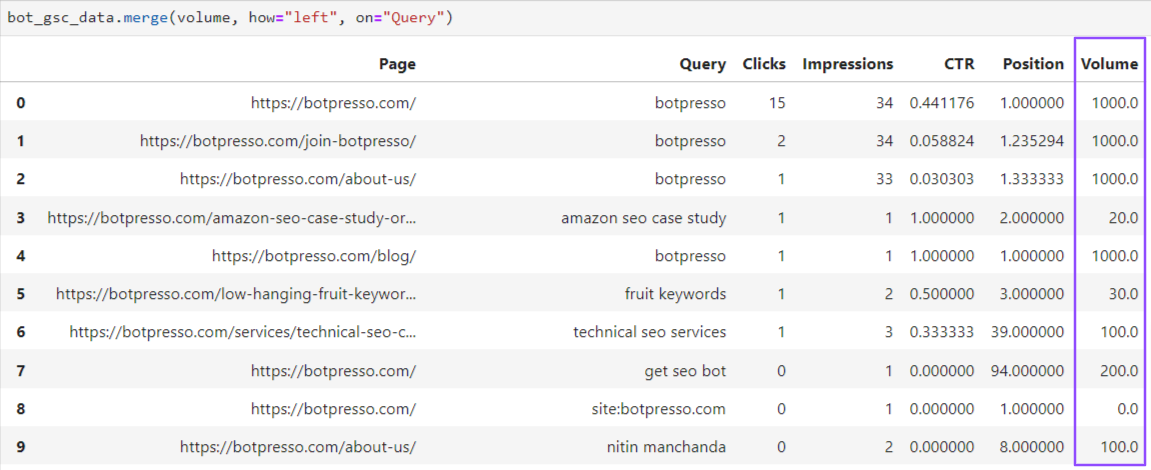
Let’s say we have two tables, one with GSC data containing Query, URL, Clicks, Impressions, & CTR and another table containing Queries and their Volume. In Excel or Google Sheets, you can use Vlookup and add the volume to the GSC table.
In Pandas, you can do this by using the one line of code:
bot_gsc_data.merge(volume, how=”left”, on=”Query”)
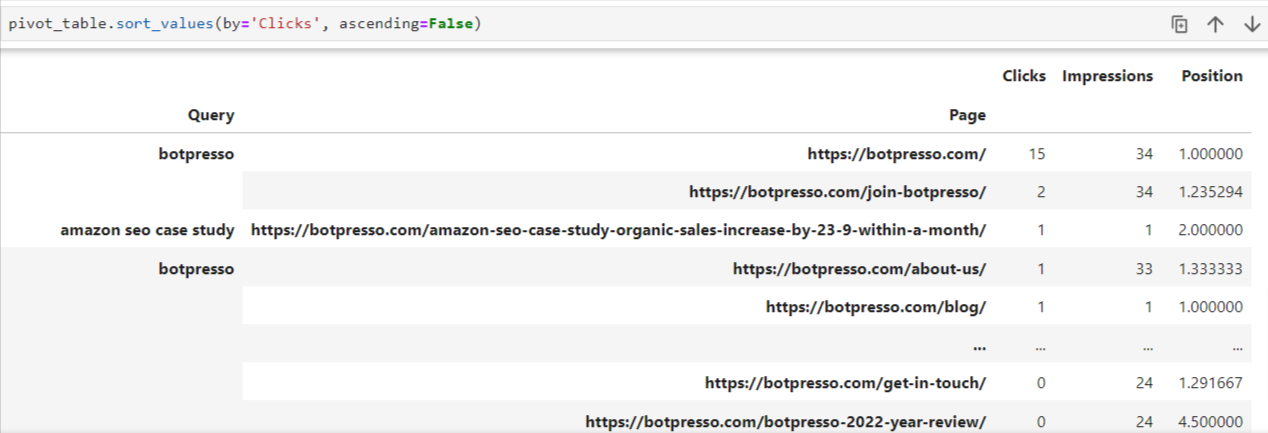
10. Sort values
You can sort any column using the sort_values function in Pandas.
👇Here’s the syntax:
yourdataframe.sort_values(by=’Column’, ascending=False or True)
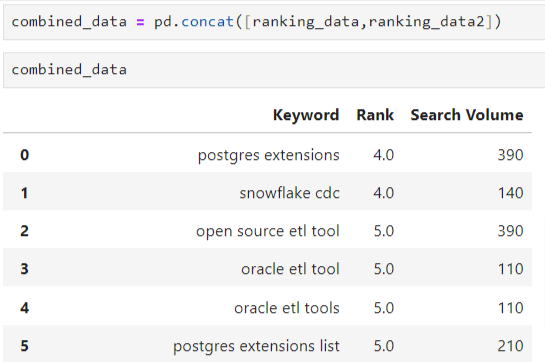
11. Combine files
You can combine two data frames or tables using the concat function in Pandas. Say, you have two keyword files you need to combine into a single file to do some operations.
You can use the following code to do the same. But make sure, the columns are the same because the code just merges two files.
combined_data = pd.concat([ranking_data,ranking_data2])
12. Save the data to CSV
Once you are done with your data analysis, you can save the output to a CSV file to share with your team. Here’s how to do it:
combined_data.to_csv(“Keyword data.csv”, index=False)
Keyword data.csv = the name of the output file.
combined_data = the output data frame you want to save.
to_csv = the function to save the data to CSV.
🎉These are just a few operations you can do with Pandas! You can learn more about Pandas and do more advanced computations on your data.
Let us know by sharing on social media, if you need more advanced tutorial on using Pandas for SEO.
📖 Related reads on Python for SEO
👉 Analyzing Content Similarity via Cosine Method


