From May 7 onwards, a large number of sites observed a sudden growth in traffic from ChatGPT. While initially this felt like a seasonal spike, the traffic growth was consistent across multiple brands that are a part of Botpresso’s SEO and AI search portfolio.
Upon doing some reading, we stumbled upon a study published by Profound that reported 200% growth in ChatGPT sessions to Profound’s own website overnight.
ChatGPT hasn’t officially announced the May 7 links update on their official Release Notes document or social media, but the platform universally started showing clickable links embedded within specific sections of their responses. We started noticing this across a sample set of 12,500+ prompts across our clients.
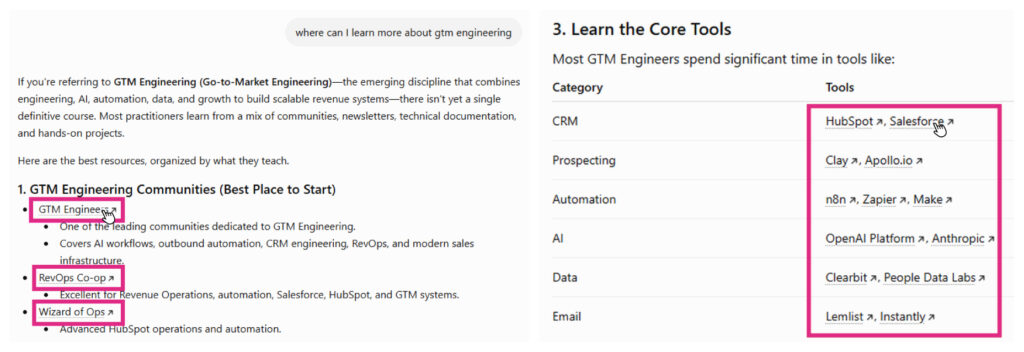
This prompted us to go down a deep rabbit hole of research across our portfolio of clients across B2B and B2C verticals to see if this hypothesis holds even after a month after the rollout of the branded citation links in ChatGPT.
This study was led by Swapnil Pate, Botpresso’s Director of Growth and Pratik Barde, one of our interns who collected all the data and analyzed impact across the portfolio.
Key Takeaways
- ChatGPT referral traffic nearly doubled: Total sessions increased 97.9%, from 183,497 to 363,089. The median site grew 54%, and 36 of 52 sites gained traffic.
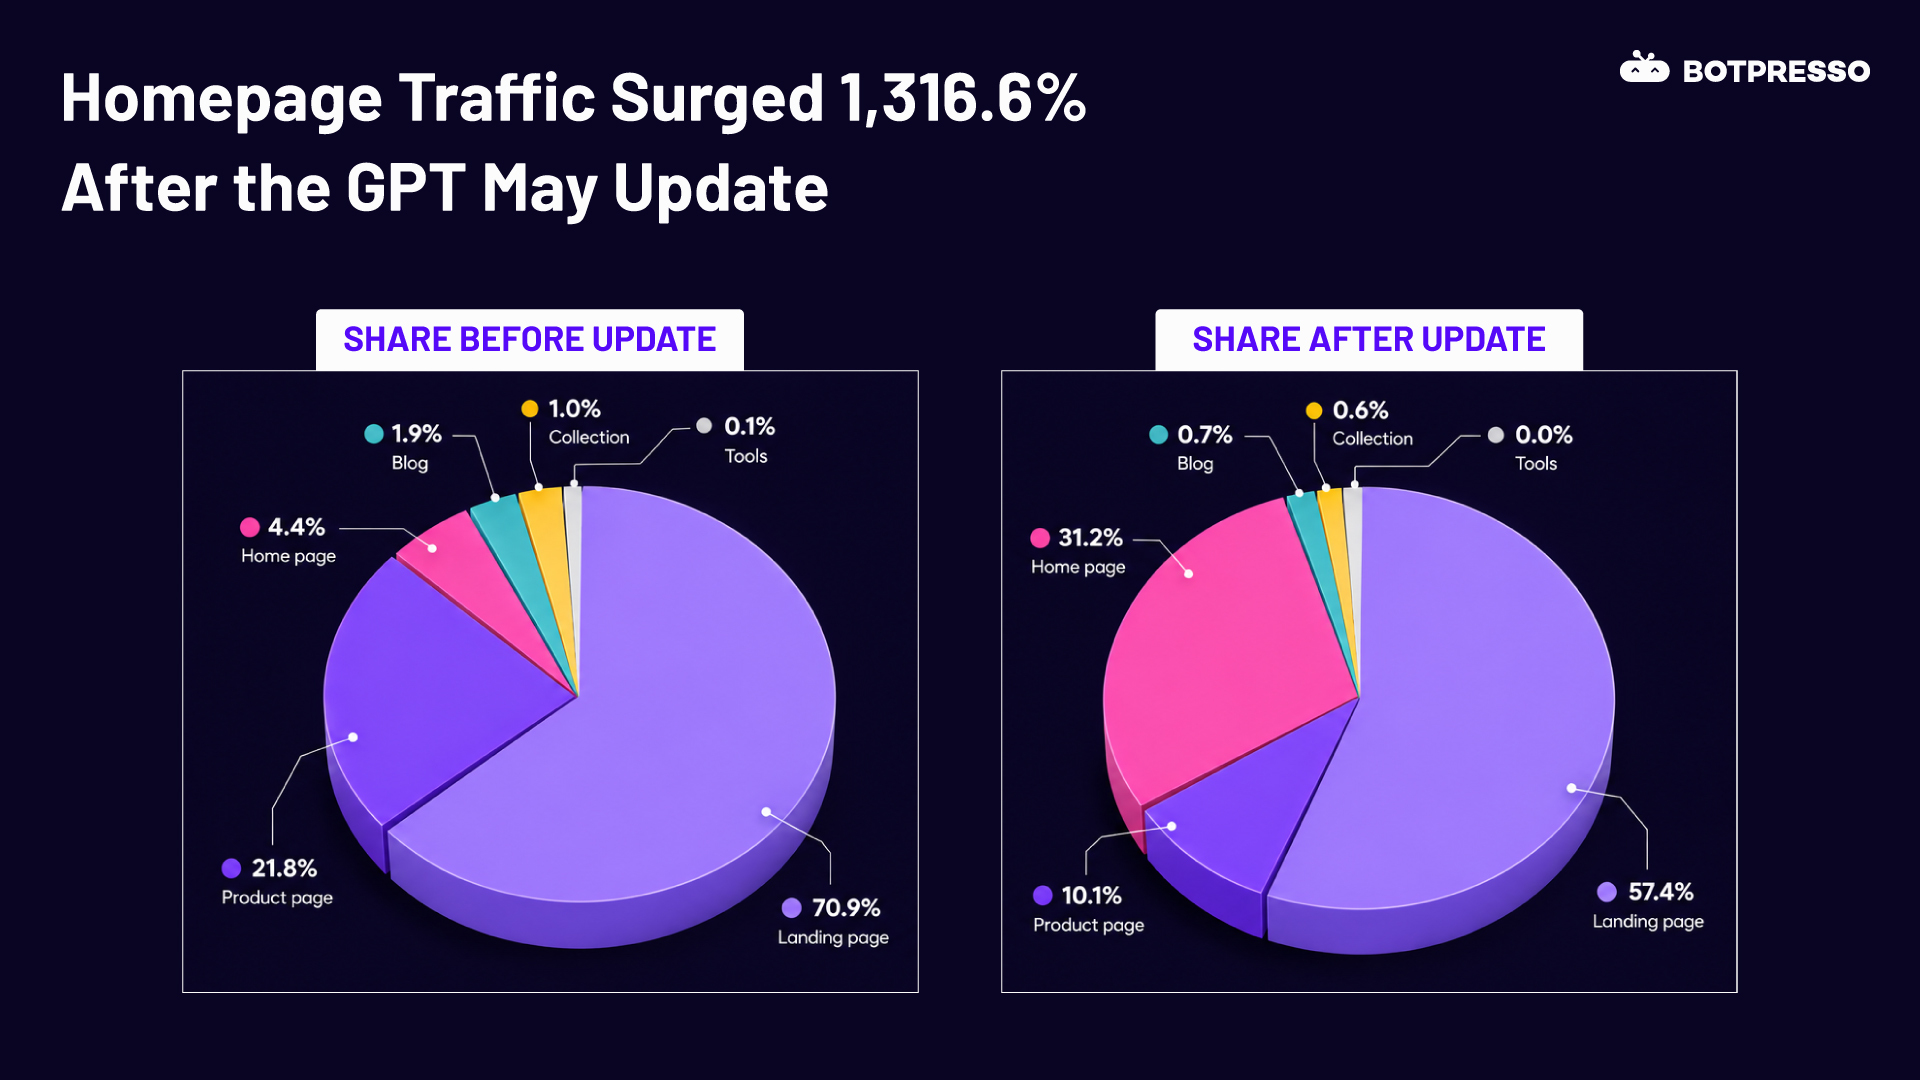
- Homepages recorded the fastest growth: Homepage sessions increased 1,316%, from 7,990 to 113,183. Their share of total ChatGPT referral traffic rose from 4.4% to 31.2%.
- Landing pages still led total traffic: Landing-page sessions increased 60%, and these pages received 57% of all post-change ChatGPT referral sessions.
- Blogs were the most consistent page-type loser: Blog sessions declined 28%, from 3,495 to 2,509, with declines in every category that recorded blog traffic.
- Page-level reporting is essential: Site-level totals can conceal a shift from high-intent product or service pages toward homepages.
Methodology
The objective was to evaluate changes in referral traffic from ChatGPT after the observed May 7, 2026 link update, when the platform began displaying clickable links in responses rather than only mentioning website names.
We analyzed GA4 data from 52 websites across global markets. The dataset included 9 B2B sites and 43 B2C sites drawn from client accounts Botpresso has managed for several years.
Traffic performance was compared across two equal six-week periods:
| Period | Date range | Purpose |
|---|---|---|
| Pre-change period | March 26, 2026 to May 6, 2026 | Establish baseline traffic before the observed clickable-link change. |
| Post-change period | May 7, 2026 to June 17, 2026 | Measure traffic after clickable links began appearing more consistently. |
Pages without ChatGPT traffic were excluded, except for homepages, which remained in the dataset even when they recorded no ChatGPT sessions. This kept the page-level analysis focused on measurable ChatGPT traffic while retaining homepage visibility across all included sites.
The analyzed page types included:
- Product pages
- Blog pages
- Collection pages
- Homepages
- Service and landing pages
- Other commercial and informational page formats
For each included website and page, sessions in the post-change period were compared with sessions in the pre-change period. The same framework was applied across site types, categories, and page types to identify where referral traffic increased or declined.
Study Snapshot
| Dimension | Pre-change sessions | Post-change sessions | Change |
|---|---|---|---|
| All 52 sites | 183,497 | 363,089 | +98% |
| Homepages | 7,990 | 113,183 | +1,316% |
| Landing pages | 130,104 | 208,255 | +60% |
| Blogs | 3,495 | 2,509 | -28% |
| Health sites | 2,880 | 1,403 | -51% |
Overall ChatGPT Referral Traffic Nearly Doubled After May 7
Across the 52 websites, ChatGPT referral sessions increased from 183,497 in the six weeks before May 7 to 363,089 in the six weeks after it. This represents a 97.9% aggregate increase. Thirty-six sites gained traffic, 14 declined, and 2 remained flat.
The aggregate result was concentrated among a small group of large winners. The top-gaining site accounted for 64% of the net increase, while the top five accounted for 91%.
The broader pattern remained positive after removing those outliers. Excluding the top five winners, the remaining 47 sites still grew 10%. The median site grew 54%, indicating that the increase was not limited to the largest gains.
Winners & Losers
When we sliced the data by site type, category, and page type, a consistent pattern emerged: who won had less to do with what industry they’re in, and more to do with where ChatGPT sends traffic.
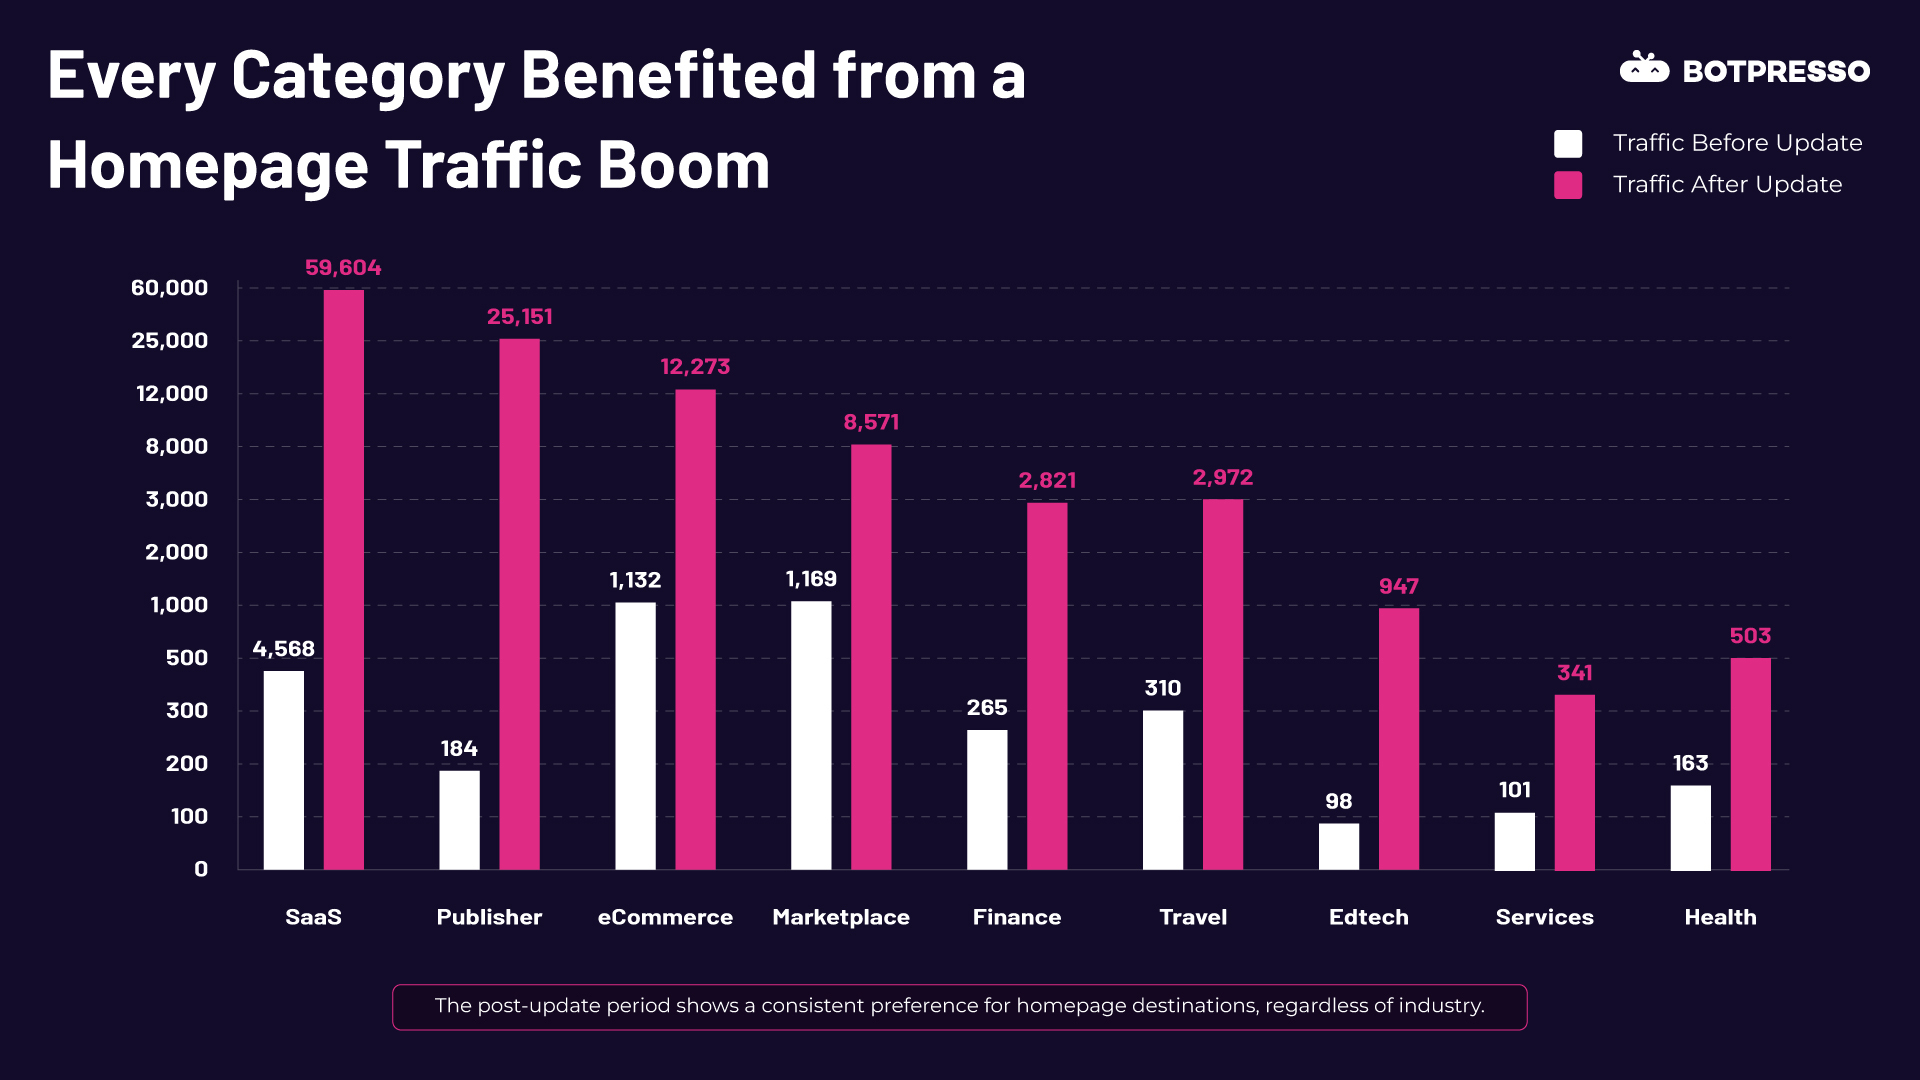
The clearest page-type winner was the homepage. Homepage sessions grew 1,316% across the dataset, rising from 4.4% to 31.2% of all ChatGPT traffic, and gains appeared at 43 of 52 sites and in all nine categories we tracked.
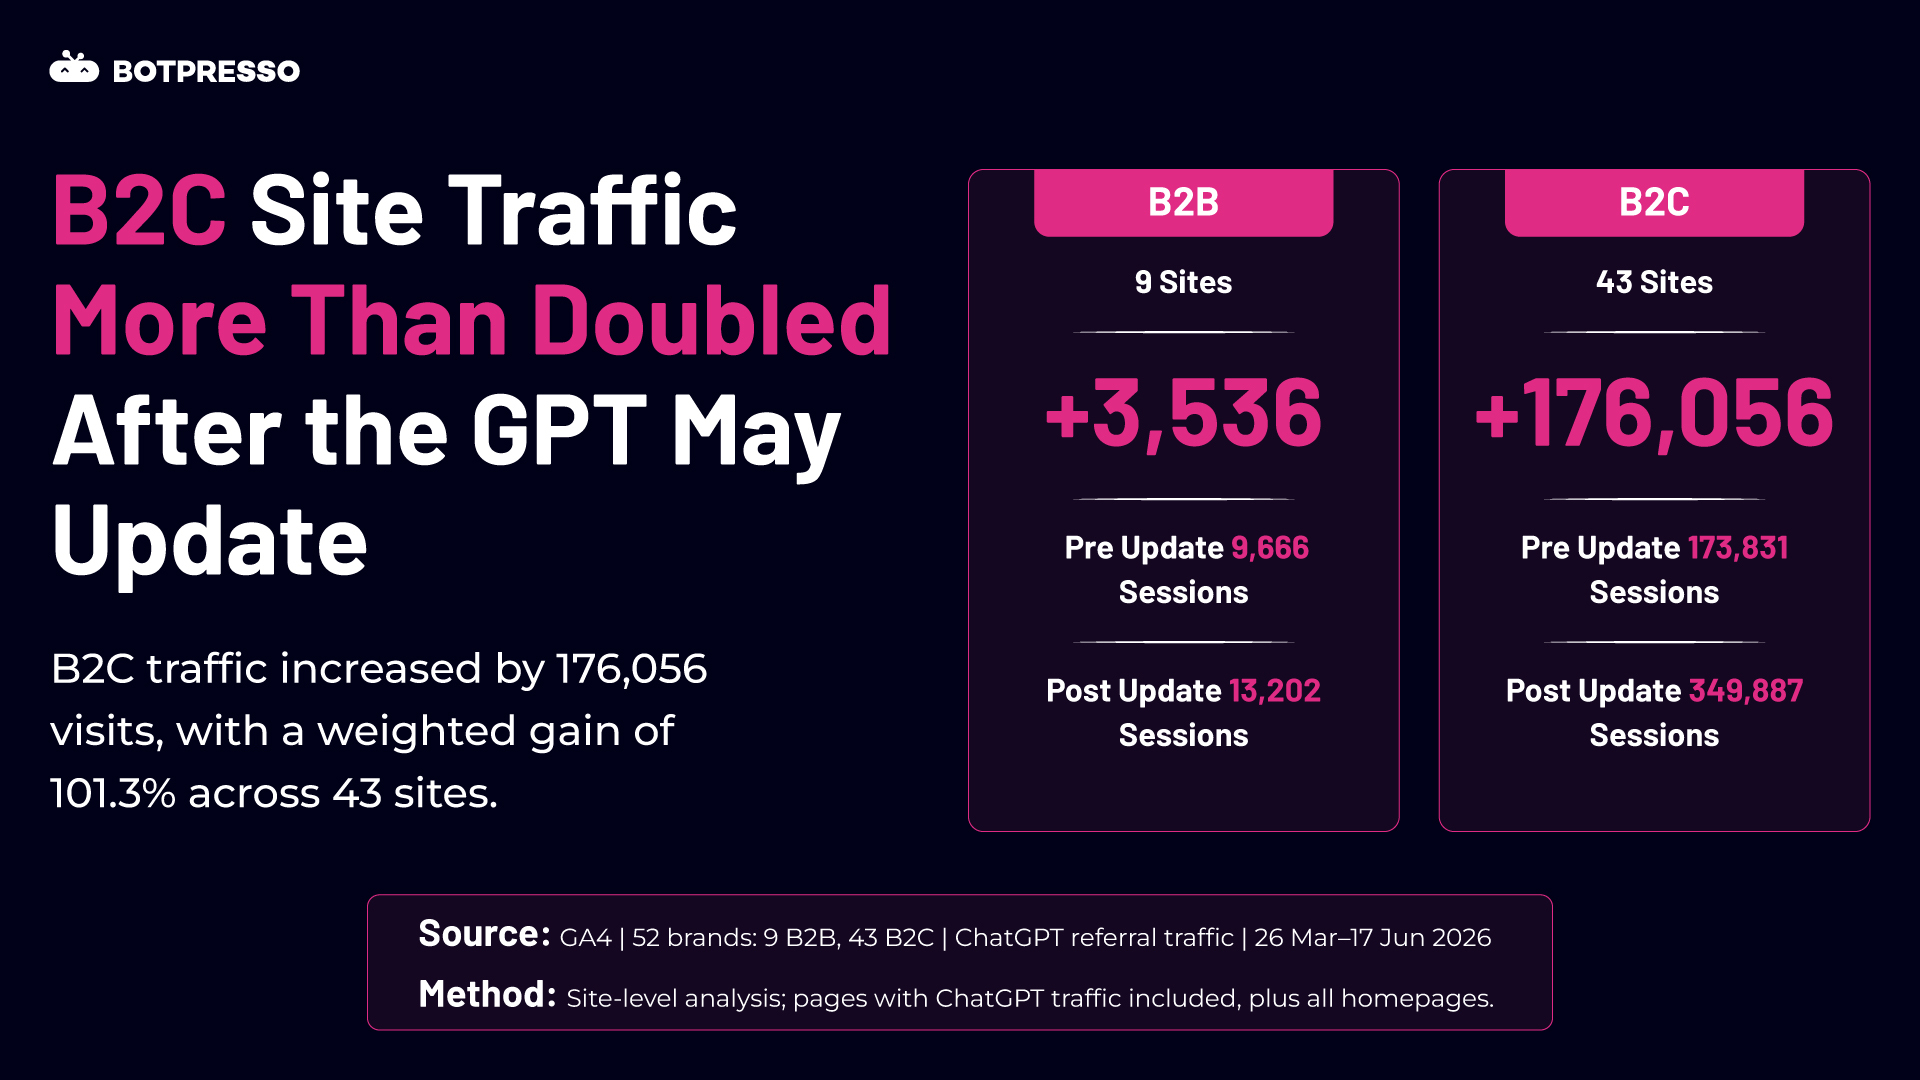
Looking at site types across all ChatGPT visits, B2C brands captured most of the upside. B2C sites grew 101% overall, with the median site up 56%, while B2B sites grew a more modest 37%, suggesting clickable branded links reward brands consumers already recognize
By category, SaaS and publishers saw the sharpest gains, growing 10x and 3.7x respectively, while eCommerce was the broadest winner with 12 of 17 stores gaining and the median store visits up 69%.
Blog traffic was the most uniform loser page type in our study. Blog sessions from ChatGPT fell 28% overall (3,495 to 2,509), declining in every single category that had blog traffic, with 13 sites losing and only 5 gaining. Most tellingly, the decline hit winners too: ten sites grew their total ChatGPT traffic while still losing blog sessions, including our biggest winner, whose traffic grew 12x while its blog referrals halved.
The likeliest explanation lies in how ChatGPT now handles informational intent. Blog content answers questions, and ChatGPT increasingly absorbs those answers into its own response, leaving no reason to click through.
Blogs may still be doing invisible work by feeding the models the expertise that earns a brand its mentions, but the click now lands somewhere else. For content teams, that means the blog’s ROI increasingly shows up in branded and homepage AI traffic rather than in the blog’s own analytics.
Homepage Traffic Increased 1,316%
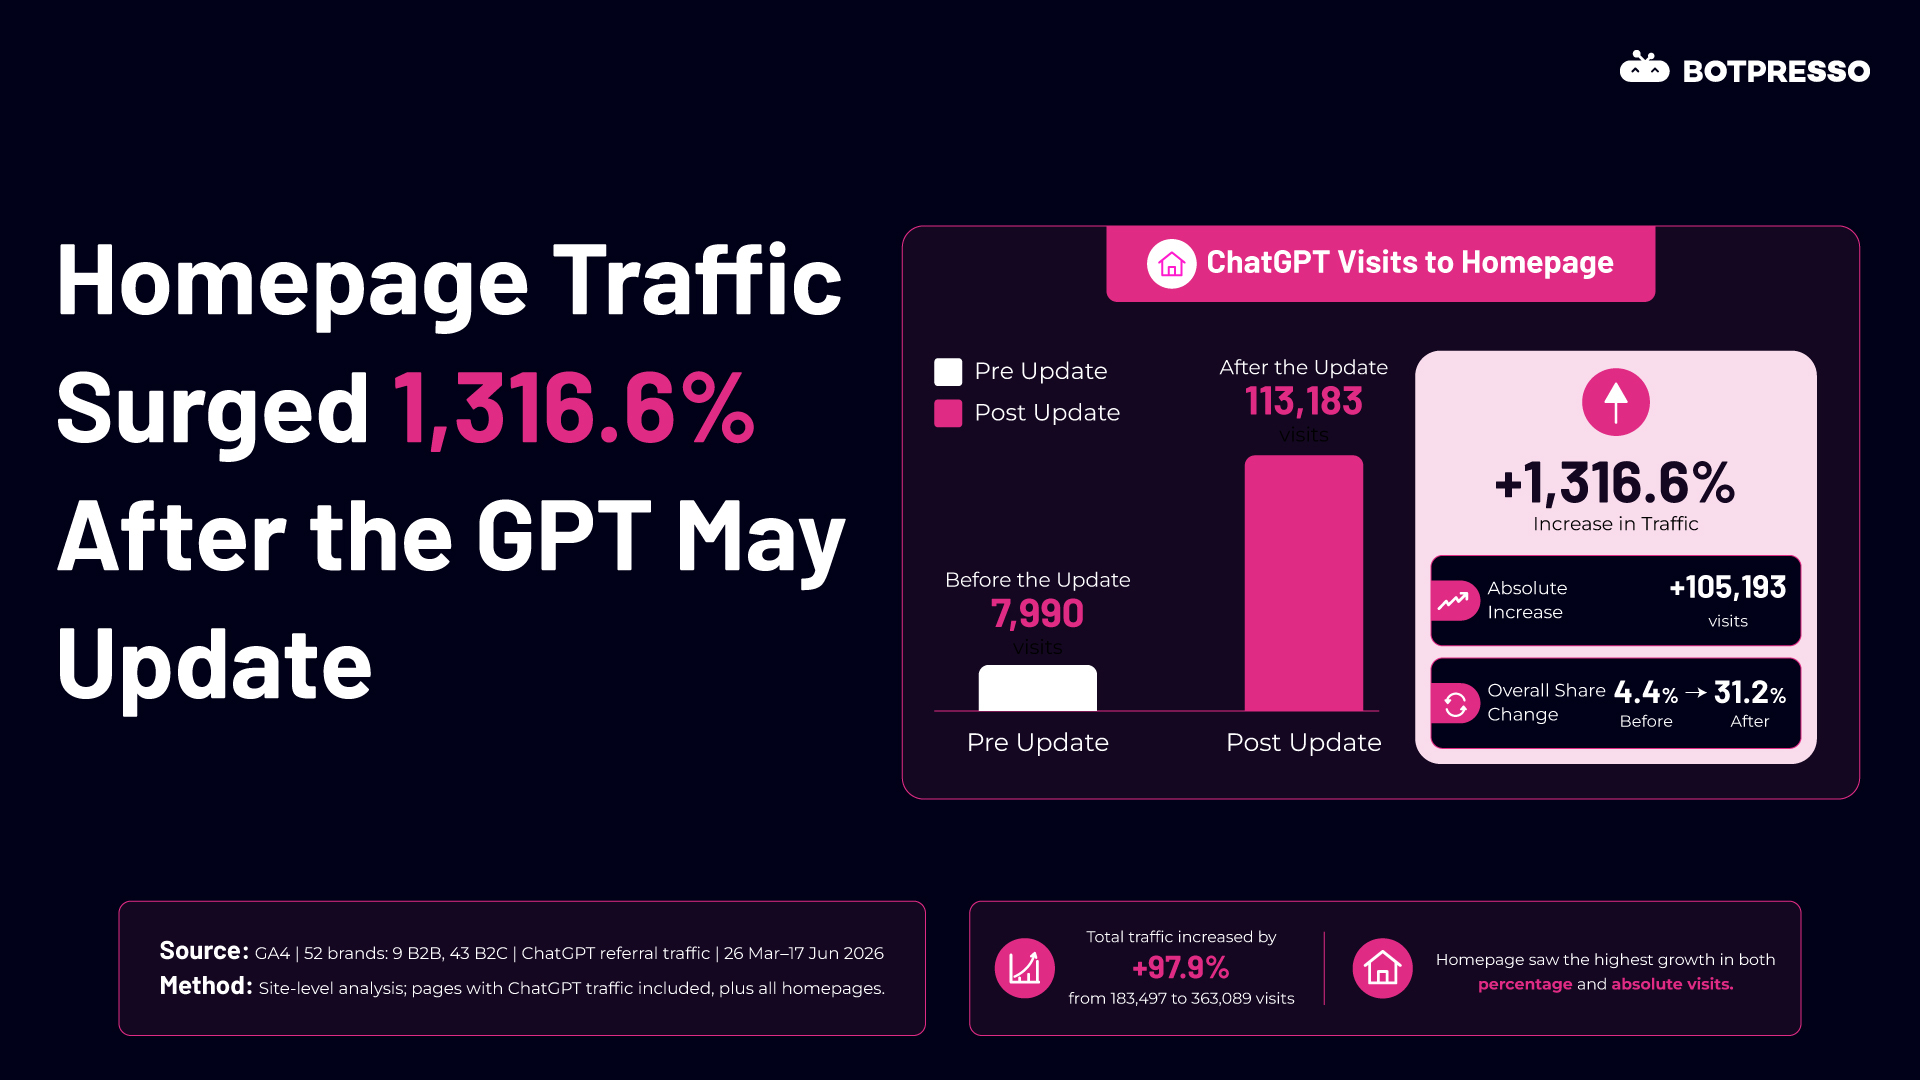
Homepage traffic was the most consistent winner in the study. Across all 52 sites, homepage sessions from ChatGPT increased from 7,990 to 113,183. This 1,316% increase raised the homepage share of total ChatGPT referral traffic from 4.4% to 31.2%.
The increase was widespread. Homepages gained traffic at 43 of 52 sites, only one site declined, and the median site’s homepage traffic increased more than fivefold.
Both B2B and B2C brands benefited, but the B2C increase was larger. B2C homepage traffic rose 1,375%, from 7,533 to 111,089 sessions, with gains at 37 of 43 sites. B2B homepage traffic rose 358%.
The increase also appeared across all nine tracked categories. SaaS generated the largest homepage traffic pool, rising from 4,568 to 59,604 sessions, an increase of 1,205%. eCommerce homepage traffic increased 984%.
Landing Pages Still Lead Overall ChatGPT Traffic
Landing pages remained the main source of ChatGPT referral traffic. Sessions increased 60%, from 130,104 to 208,255.
They were the second-largest gainer in absolute terms and the second-most consistent winner after homepages. Landing-page traffic increased at 34 sites and declined at 15.
Landing pages accounted for 57% of all post-change ChatGPT referral sessions, more than every other page type combined. Their share fell from 71% to 57%, but their absolute traffic still grew substantially. The change therefore reflects a shift in traffic mix rather than a decline in landing-page sessions.
When ChatGPT deep-links, commercial landing pages appear to align with recommendation-oriented prompts. Purpose-built comparison pages, category explainers, persona pages, and use-case pages may therefore remain important deep-link assets.
Commercial Content Gained in Most Categories
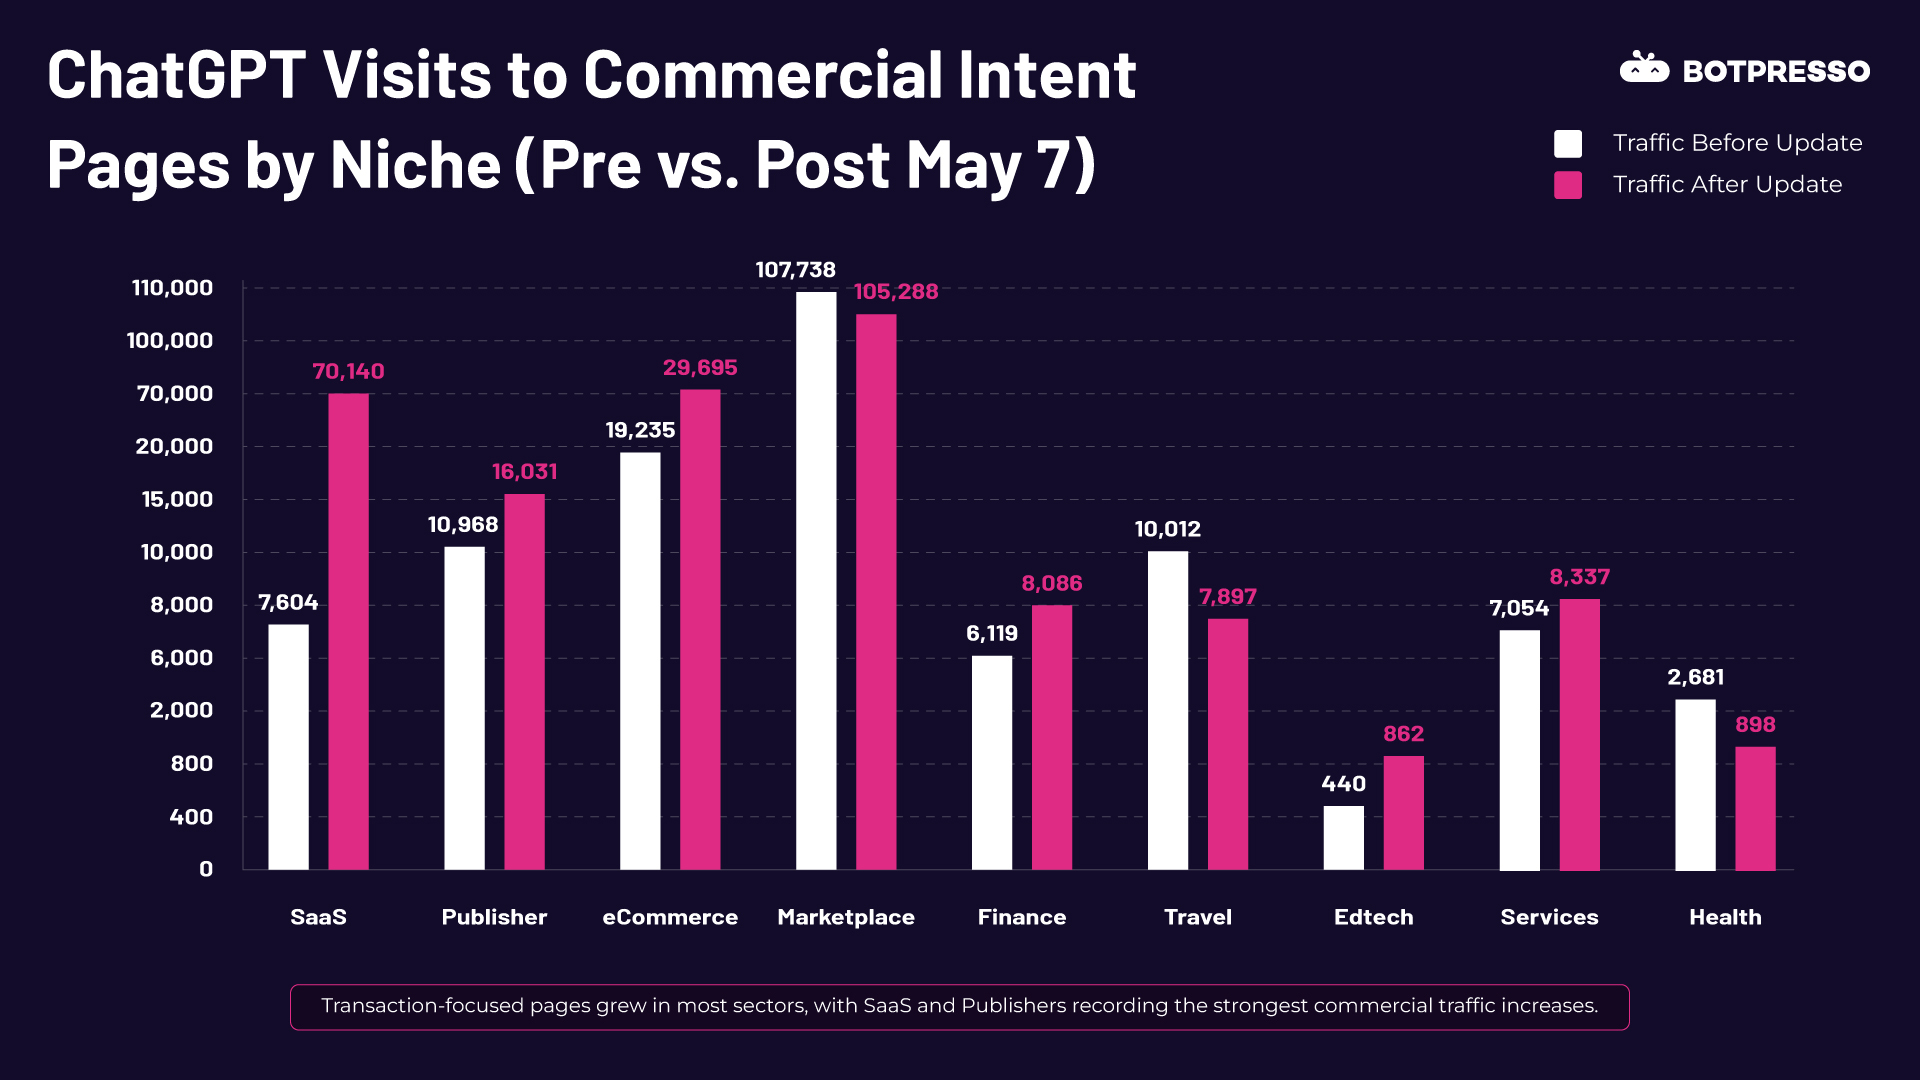
High-intent commercial pages increased in most tracked categories. SaaS recorded the largest gain, rising from 7,604 to 70,140 sessions. Publisher, eCommerce, finance, edtech, and services pages also increased, while marketplace, travel, and health declined.
Blog Referral Traffic Fell 28%
Blog traffic was the most consistent page-type loser. ChatGPT sessions to blogs declined 28%, from 3,495 to 2,509. Blog traffic fell in every category that recorded it, with 13 sites losing traffic and only 5 gaining.
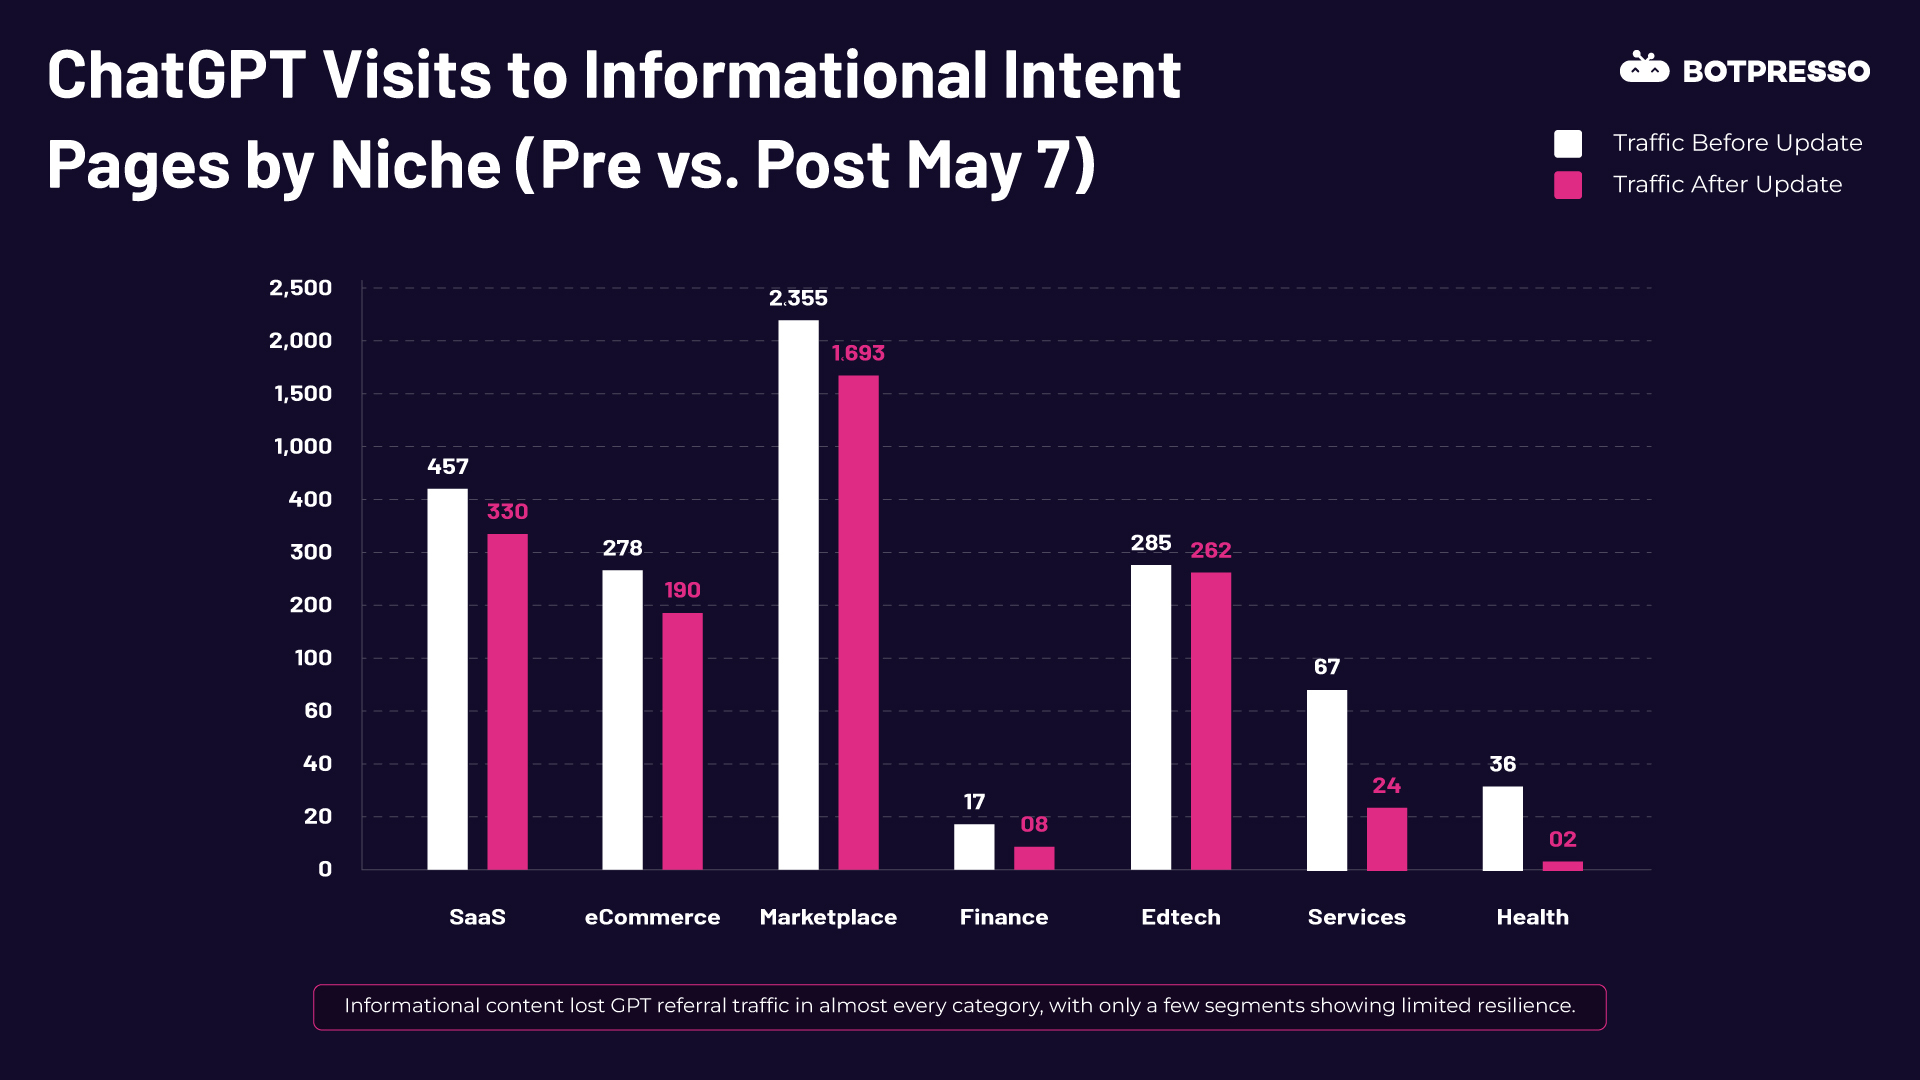
The decline also affected sites whose total ChatGPT traffic increased. Ten sites grew overall while losing blog sessions. The largest overall winner grew twelvefold, while its blog referrals fell by half.
One possible explanation is that informational content is increasingly summarized inside ChatGPT responses, reducing the need for users to click through to the source page. This mechanism was not directly tested in the study.
Blogs may still contribute indirectly by establishing the expertise associated with brand mentions and citations. Under that interpretation, some of the blog’s value may appear in branded or homepage referral traffic rather than in the blog’s own session count.
Health Was the Only Category to Lose ChatGPT Traffic
Health sites declined from 2,880 to 1,403 sessions, a 51% decrease. A large portion of the decline came from one medical platform whose landing-page traffic fell 73%.
The broader page-type pattern still appeared within health. Homepage traffic increased 209%, while commercial-page traffic fell 67% and blog traffic fell 94%.
One hypothesis is that health’s status as a Your Money or Your Life category contributed to a stronger shift away from deep commercial links and toward domain-level citations. The study did not test this explanation, so it should be treated as an interpretation rather than a causal finding.
For health and wellness sites, the immediate reporting priority is to separate AI referrals by page type. This can reveal whether service and commercial pages are losing traffic while the homepage gains. Recommended citation signals include named medical reviewers, author credentials, and consistent entity information.
What This Study Can and Cannot Show
- The analysis is observational: It shows traffic changes after May 7, not proof that the link change caused every increase or decline.
- Growth was concentrated: The top site accounted for 64% of the net increase and the top five accounted for 91%, although the median site still grew 54%.
- Page inclusion was selective: Pages without ChatGPT traffic were excluded, except for homepages. Results therefore describe pages with measurable referral activity rather than every page on each site.
- Prompt-level citation data was not included: Explaining why specific brands and page types gained would require prompt-level citation analysis.
Testing and Optimization Recommendations
1. Optimize the Homepage for AI-Referred Visitors
- Audit for high-intent needs: Review whether a first-time visitor can quickly find bestsellers, key comparisons, pricing, use cases, or frequently cited answers.
- Make important paths visible: Create clear above-the-fold routes to the pages most likely to answer the visitor’s question.
- Test AI-specific navigation: Evaluate prominent search, navigation modules, and content blocks aligned with the questions for which ChatGPT mentions the brand.
- Measure the homepage as an AI landing page: Track engagement and conversion for ChatGPT-referred sessions rather than treating all homepage visits as one audience.
- Trial dynamic experiences carefully: Test content variations for sessions with a ChatGPT referrer and compare performance with the existing baseline.
2. Track AI Search Traffic at the Page Level
- Build a page-type view: Segment ChatGPT and other AI referrals by homepage, product pages, landing pages, collections, blogs, and other key formats in GA4 or Looker Studio.
- Watch for destination shifts: Sixteen of the seventeen sites that lost product-page traffic also recorded higher homepage traffic. A stable site-level total can therefore hide a loss of high-intent deep-page visits.
- Diagnose declining commercial pages: Where product or service pages lose share, review content structure, structured data, product feeds, and titles that mirror prompt language.
- Create a monthly snapshot: Track both total AI traffic and changes in page mix because the distribution of referrals can shift quickly without a formal platform announcement.
Baking AI Search Analysis Into Reporting Frameworks
Most executives today are struggling to keep up with AI search updates, their current impact on their brand, and what their strategic focus should be for growth in AI search visibility.
As SEOs, it’s our responsibility to keep the management updated about how we are seeing the space evolve and how it is affecting our brand today.
One of the starting points can be to start adding an AI search summary which talks about the overall traffic and leads or sales from AI search, and whether there’s a meaningful change in pages or sections of the site getting AI search visibility.
Reporting positive fluctuations in your AI search traffic and citing studies like this can help build a better conviction that even though AI search is still in a nascent stage, there are levers that you can pull to see a meaningful, and quantifiable impact for your business.
How Botpresso Can Help
Looking to build a competitive AI search strategy with management buy-in? Botpresso can help you build an AI search optimization strategy that helps not just with visibility growth, but also contributes to conversions in a zero-click search era.