Have you ever wondered how handy it would be to measure the content publishing velocity of any website within minutes? Well, now you can!
But before jumping into the details, let’s understand what content publishing velocity really means.
What is Content Publishing Velocity?
Content publishing velocity simply refers to the number of new content pages published on a website over a given period. This could be daily, weekly, biweekly, or monthly.
Why Does Publishing Velocity Matter?
The idea here is not to emphasize quantity.
SEO is undoubtedly a quality-over-quantity game. However, websites aren’t black and white either.
For instance, if you’re helping a client whose SEO success depends heavily on content-led growth, publishing velocity becomes a critical factor. This is particularly true for niches like publisher SEO and SaaS SEO.
Consider this:
- What if your competitor is aggressively publishing new content while you’re not?
- What if that’s what’s giving them an edge over you?
To address this, we’ve built a simple Python script that calculates publishing velocity by analyzing XML sitemaps.
What You Need Before Running the Script
- XML Sitemaps containing date information.
- Advertools Python Library for sitemap scraping.
- Google Colab is the IDE that runs the script and visualizes trends.
Here’s the Google Colab link for quick access: Click Here
Step-by-Step Guide to Measure Publishing Velocity
Step 1: Install Required Libraries
Start by installing the necessary packages to scrape sitemap data and visualize the results. Run the following command:
					# Install the necessary packages
!pip install advertools plotly pandas
This installs Advertools for sitemap scraping and Plotly for creating data visualizations.
Step 2: Import Required Libraries
Now, import the libraries you’ll need for data handling and visualization:
					# Importing required libraries
import advertools as adv
import pandas as pd
import plotly.express as px
Step 3: Specify the Sitemap URLs
List the URLs of the sitemaps you want to analyze. You can add as many as you need:
					sitemap_urls = [
    "https://domain.com/sitemap_2024_week47.xml",
    "https://domain.com/news-sitemap.xml"
]
You can include multiple sitemaps, even if you have hundreds of them.
Step 4: Download URLs & Create Dataframe
Create a function to download and parse the sitemaps, which will be combined into a DataFrame for easy handling:
					# Function to download and parse the sitemap and create a DataFrame
def sitemap_to_df(sitemap_urls):
    sitemap_df = pd.DataFrame()
    for sitemap in sitemap_urls:
        temp_df = adv.sitemap_to_df(sitemap)
        sitemap_df = pd.concat([sitemap_df, temp_df], ignore_index=True)
    return sitemap_df
Step 5: Fetch URLs from the Sitemap
Use the function created in Step 4 to fetch and merge data from all the sitemaps:
					# Extracting URLs from the sitemaps
sitemap_df = sitemap_to_df(sitemap_urls)
Step 6: Handle Published Date & Remove Duplicates
It’s important to remove any duplicate URLs to avoid skewed results. This function will help:
					# Handling the published date and removing duplicates
sitemap_df = sitemap_df.drop_duplicates(subset=['loc'])
Step 7: Extract and Handle Publication Date
Next, extract the publication date from the sitemaps, ensuring that if there are multiple date fields, the latest one is used. If a date is missing, it will be marked as NaT (Not a Time).
					if 'lastmod' in sitemap_df.columns and 'news_publication_date' in sitemap_df.columns:
    sitemap_df['published_date'] = sitemap_df['lastmod'].fillna(sitemap_df['news_publication_date']).fillna(pd.NaT)
elif 'lastmod' in sitemap_df.columns:
    sitemap_df['published_date'] = sitemap_df['lastmod'].fillna(pd.NaT)
elif 'news_publication_date' in sitemap_df.columns:
    sitemap_df['published_date'] = sitemap_df['news_publication_date'].fillna(pd.NaT)
else:
    sitemap_df['published_date'] = pd.NaT
Step 8: Filter Valid Published Dates
Now, we’ll filter out any rows where the published date is missing or invalid, ensuring the dataset only includes valid entries.
					# Filtering rows that have valid published dates
sitemap_df['published_date'] = pd.to_datetime(sitemap_df['published_date'], errors='coerce')
sitemap_df = sitemap_df.dropna(subset=['published_date'])
Step 9: Adjust Date Format
Next, we’ll simplify the date format by extracting only the date (ignoring the time):
sitemap_df['published_date'] = sitemap_df['published_date'].dt.date
Step 10: Count Pages Published per Day
Group the data by publication date to calculate how many pages were published each day:
publishing_velocity = sitemap_df.groupby('published_date').size().reset_index(name='no_of_pages')
Step 11: Visualize Publishing Trends
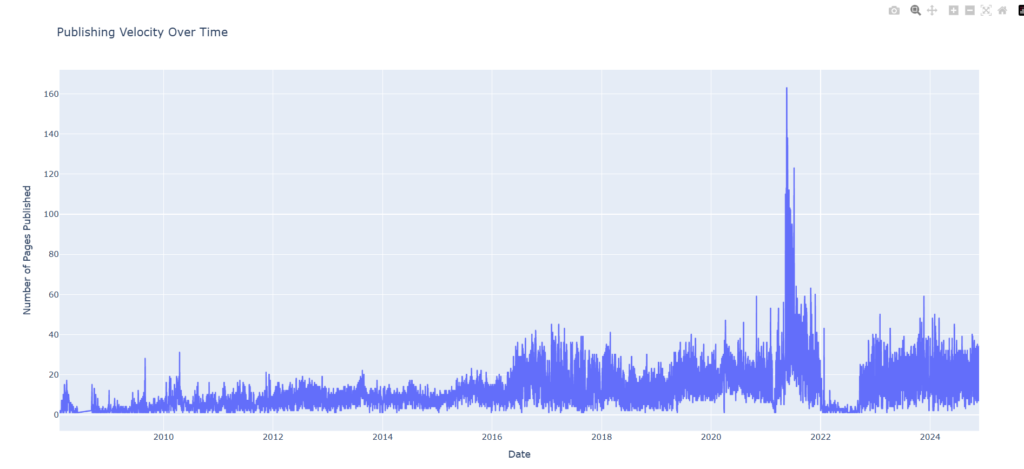
Finally, use Plotly to create a line graph that shows publishing velocity over time. This will help you identify trends and activity peaks.
					# Plotting the publishing velocity
fig = px.line(
    publishing_velocity,
    x='published_date',
    y='no_of_pages',
    title='Publishing Velocity Over Time',
    labels={
        'published_date': 'Date',
        'no_of_pages': 'Number of Pages Published'
    }
)

# Displaying the Plotly visualization
fig.show()
What You’ll See?
After running the script, you’ll get a clear graph showing the number of pages published over time. This will help you identify trends, compare competitor activity, and make better decisions for content-led SEO.

Final Thoughts
This script is an effective way to measure and visualize website publishing velocity. Whether you’re benchmarking competitors or analyzing your own publishing frequency, it provides valuable insights with minimal effort.


